最終アップデート:2022年3月22日
** 3月20日までのデータに基づく分析です。画像はクリックすると拡大します。
図表の作成に用いたコードやデータファイルはここからダウンロードできます。
東京の他のページへのリンク
ケースA:基本再生産数 3.5
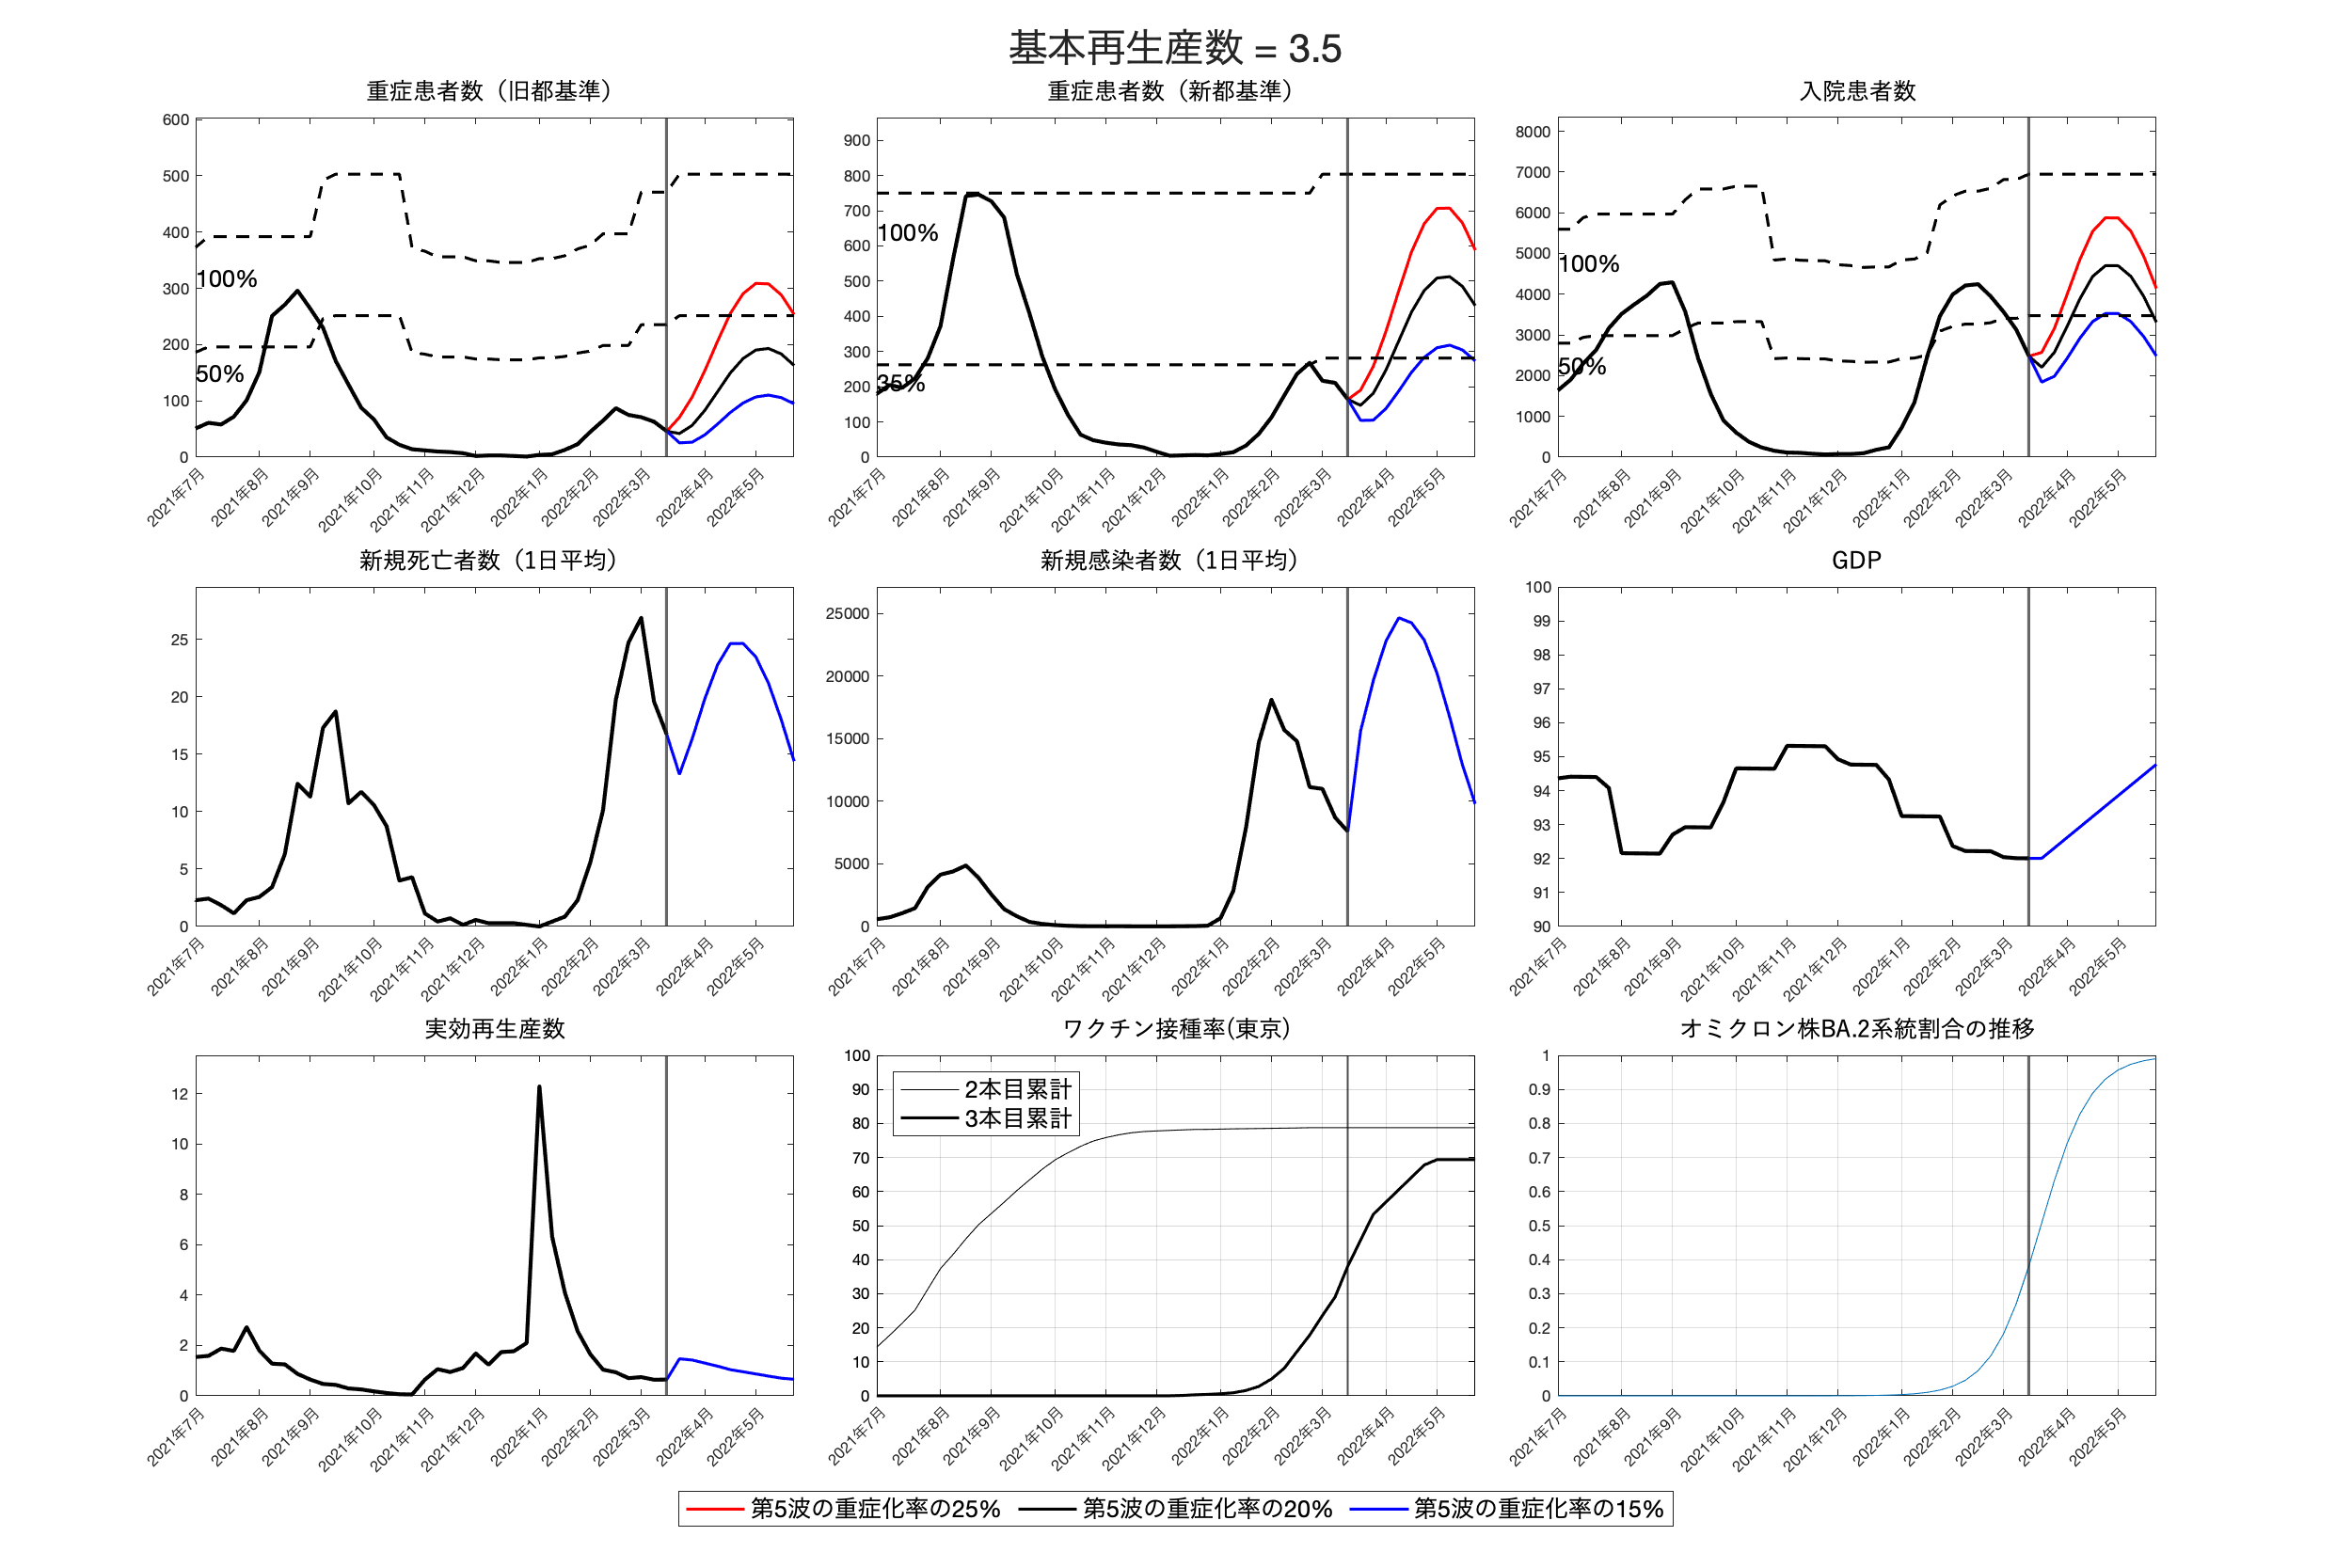 |
この図表のバックデータはここからダウンロードしてください。
出所: 著者達の計算による。
注:シナリオの詳細は「(3月22日)コロナ感染と経済の見通し」を参照
ケースB:基本再生産数 2.5
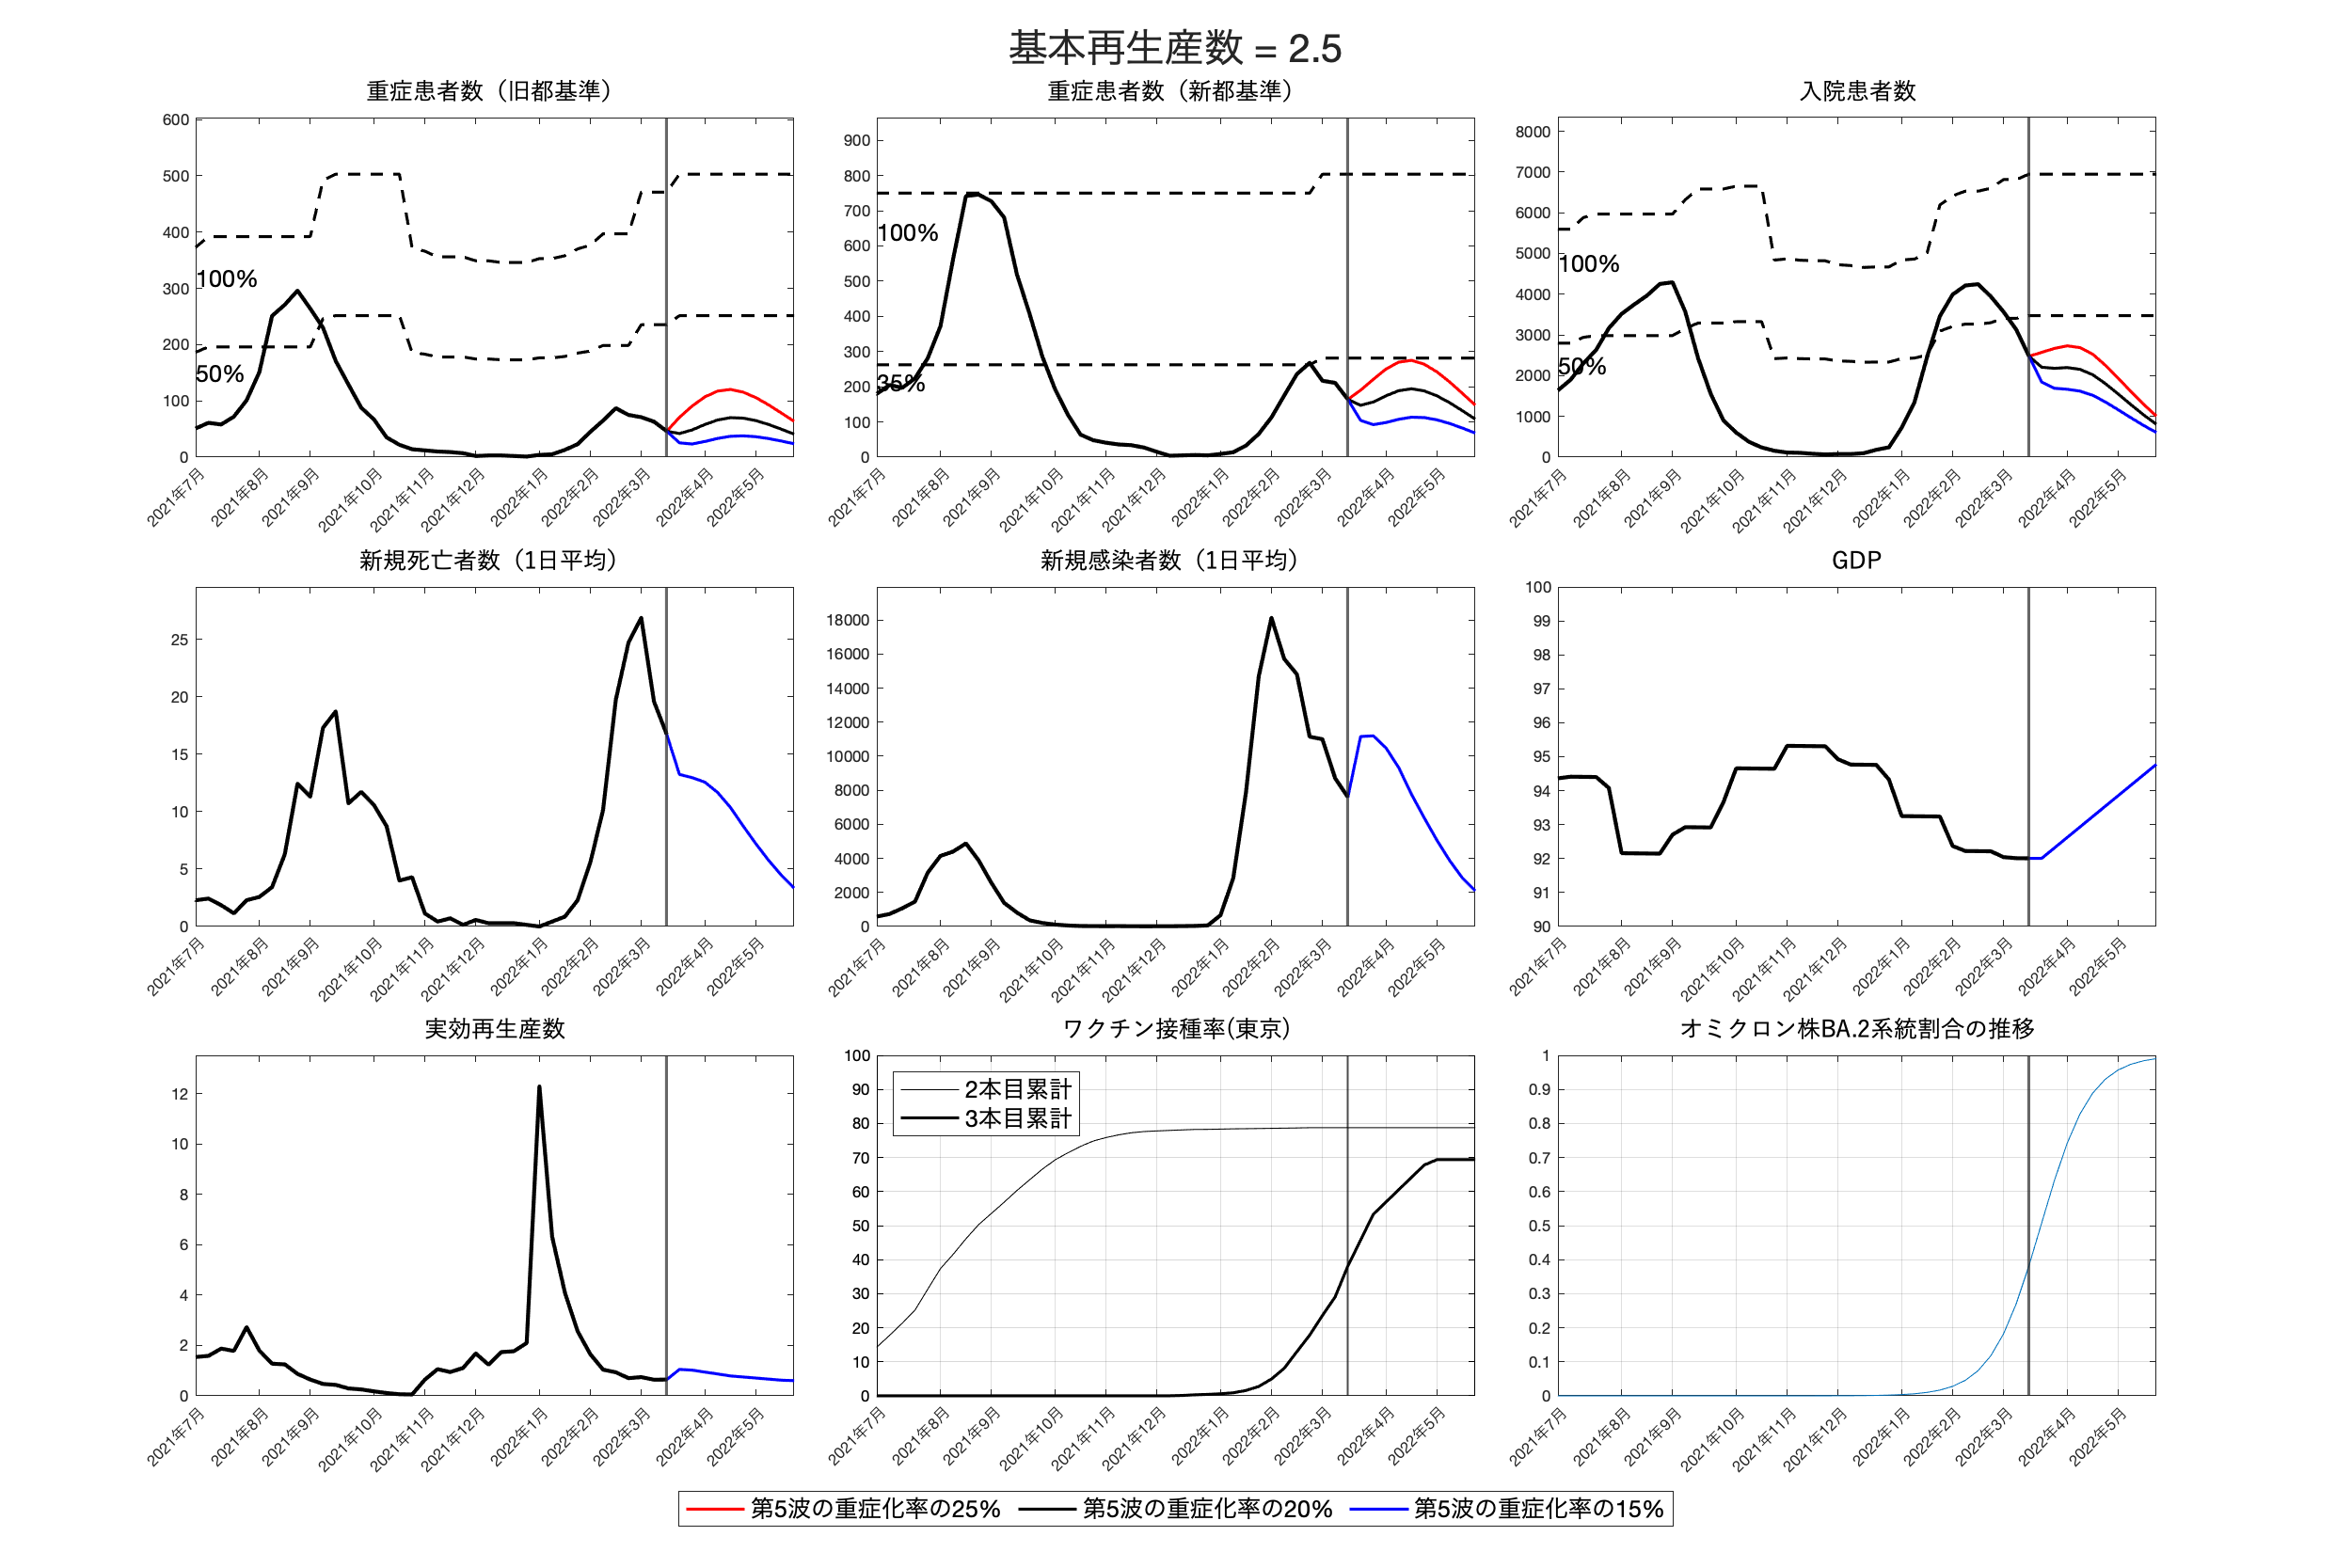 |
この図表のバックデータはここからダウンロードしてください。
出所: 著者達の計算による。
注:シナリオの詳細は「(3月22日)コロナ感染と経済の見通し」を参照
ケースC:基本再生産数 1.5
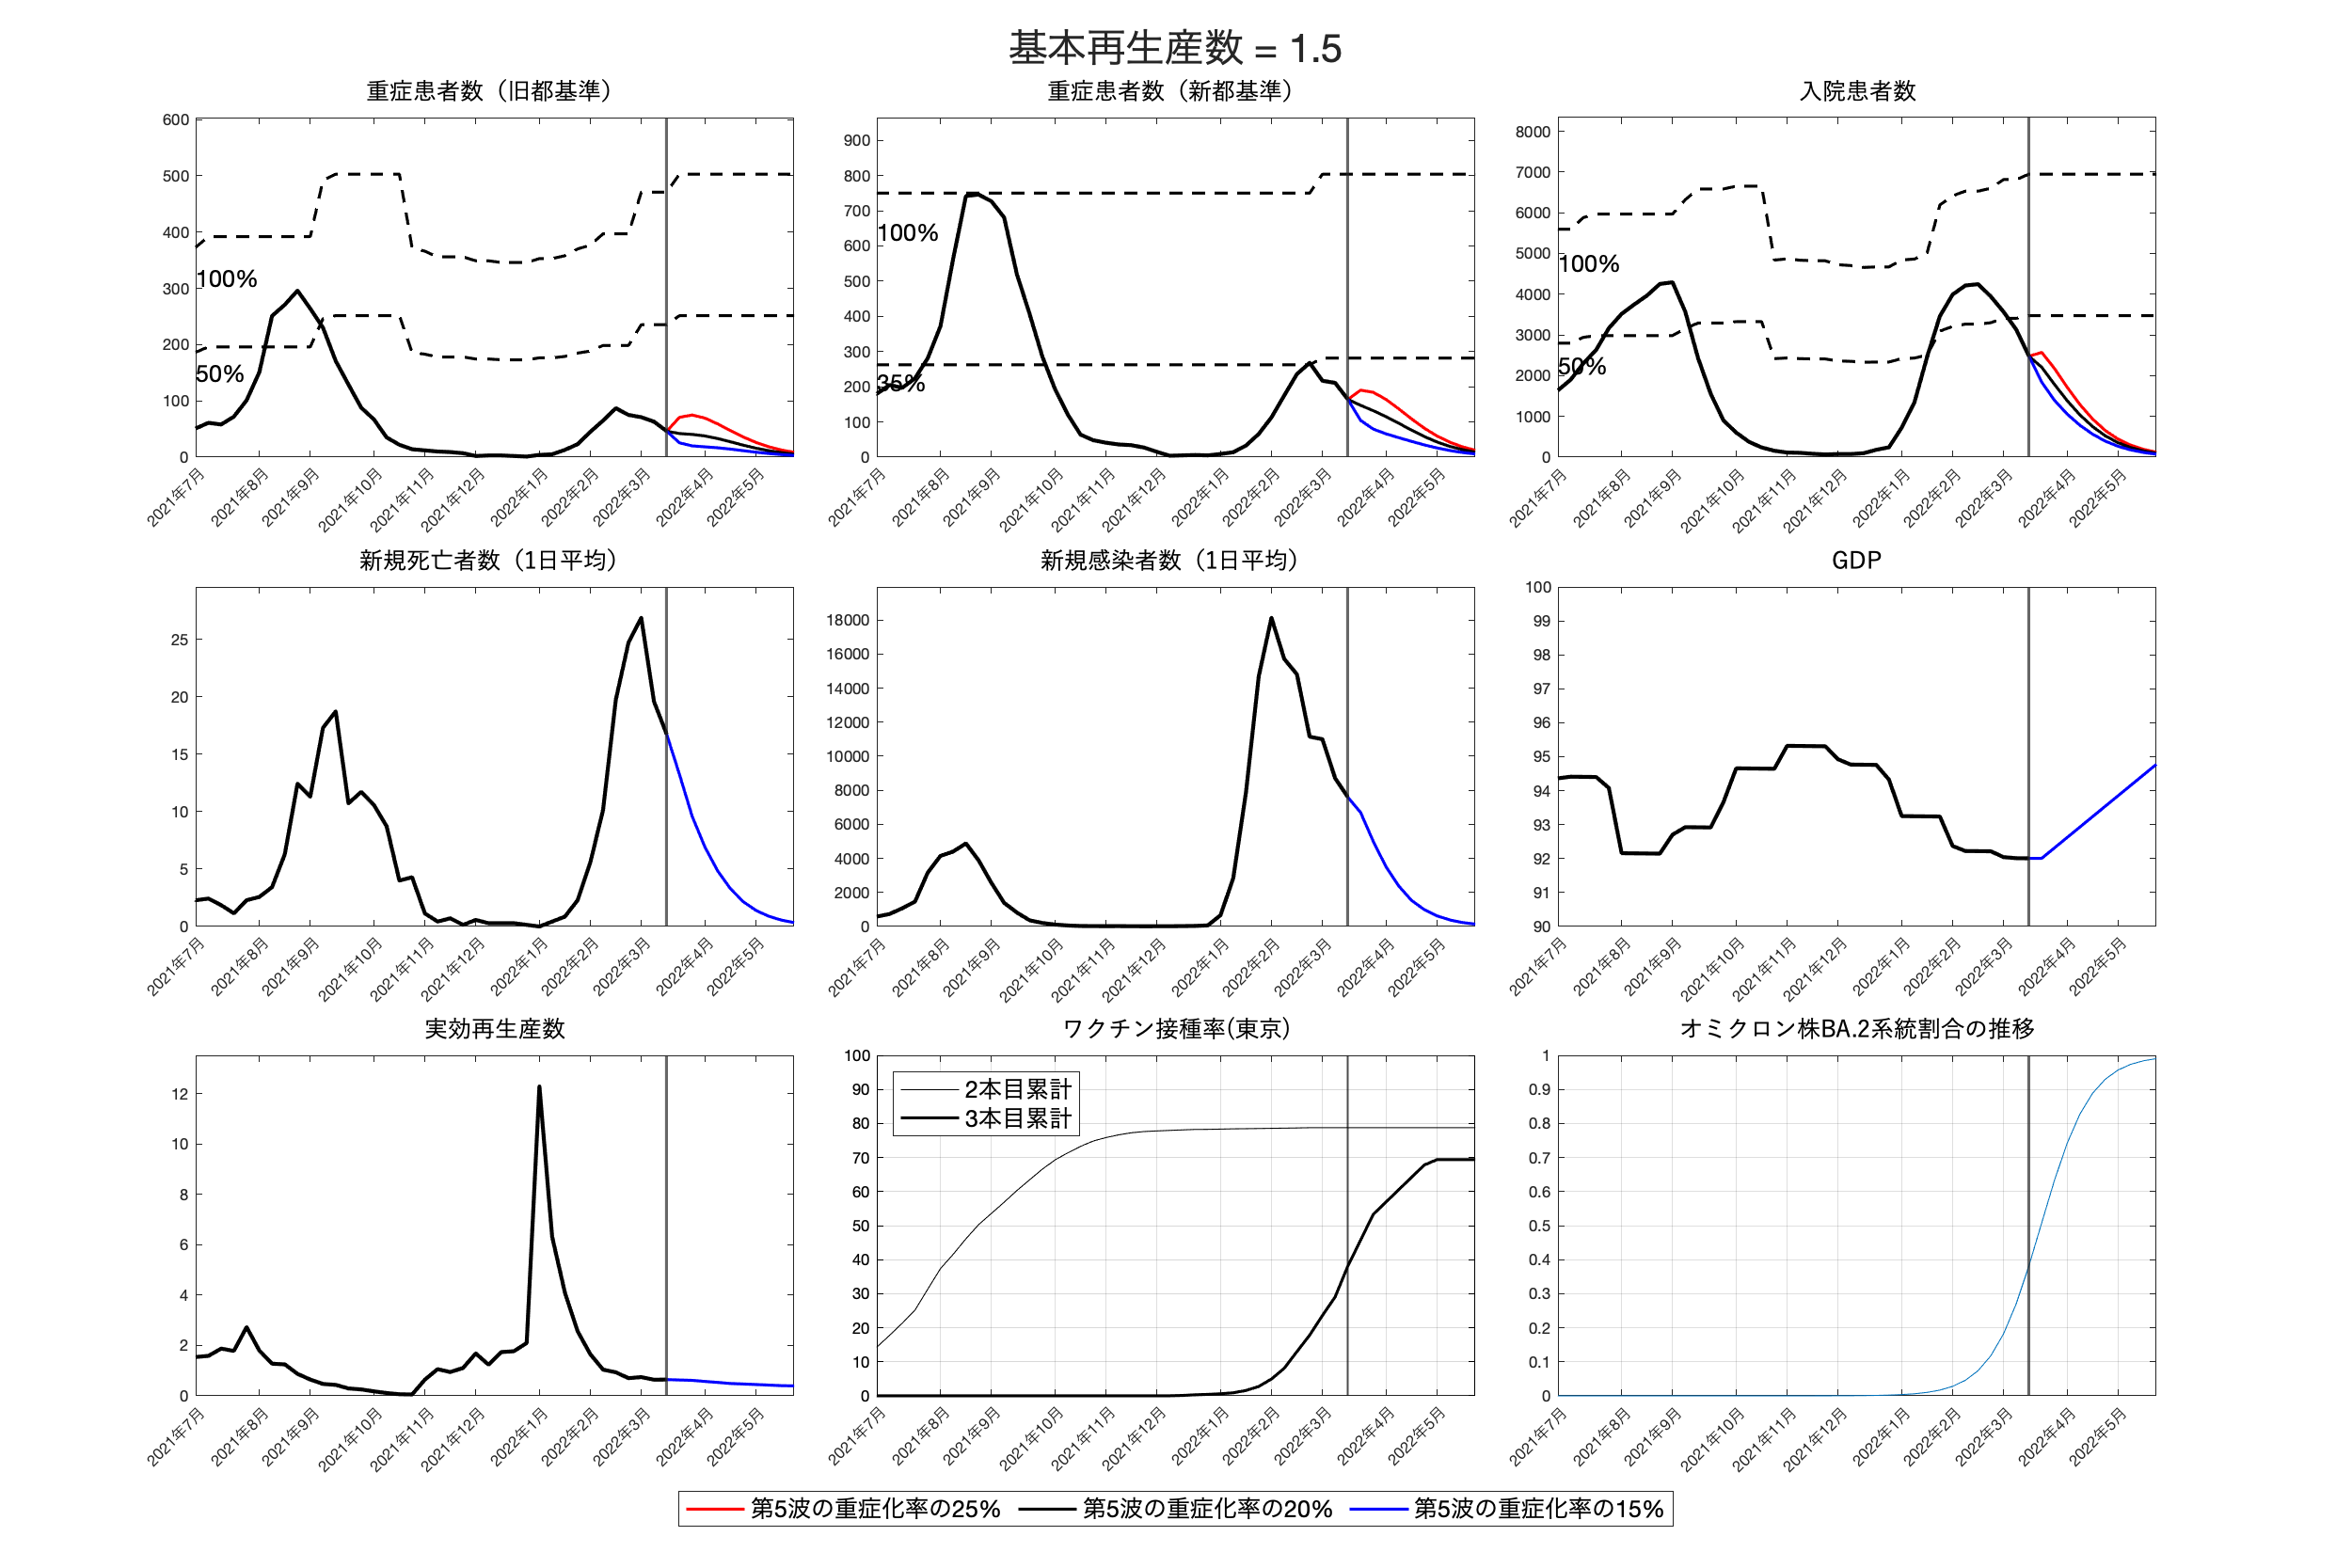 |
この図表のバックデータはここからダウンロードしてください。
出所: 著者達の計算による。
注:シナリオの詳細は「(3月22日)コロナ感染と経済の見通し」を参照