Last update on February 9, 2021
** Based on the data available as of February 7, 2021. Click to enlarge each image.
Replications files are available here.
Link to other Tokyo pages:
1. Scenarios with gradual recovery of economic activity
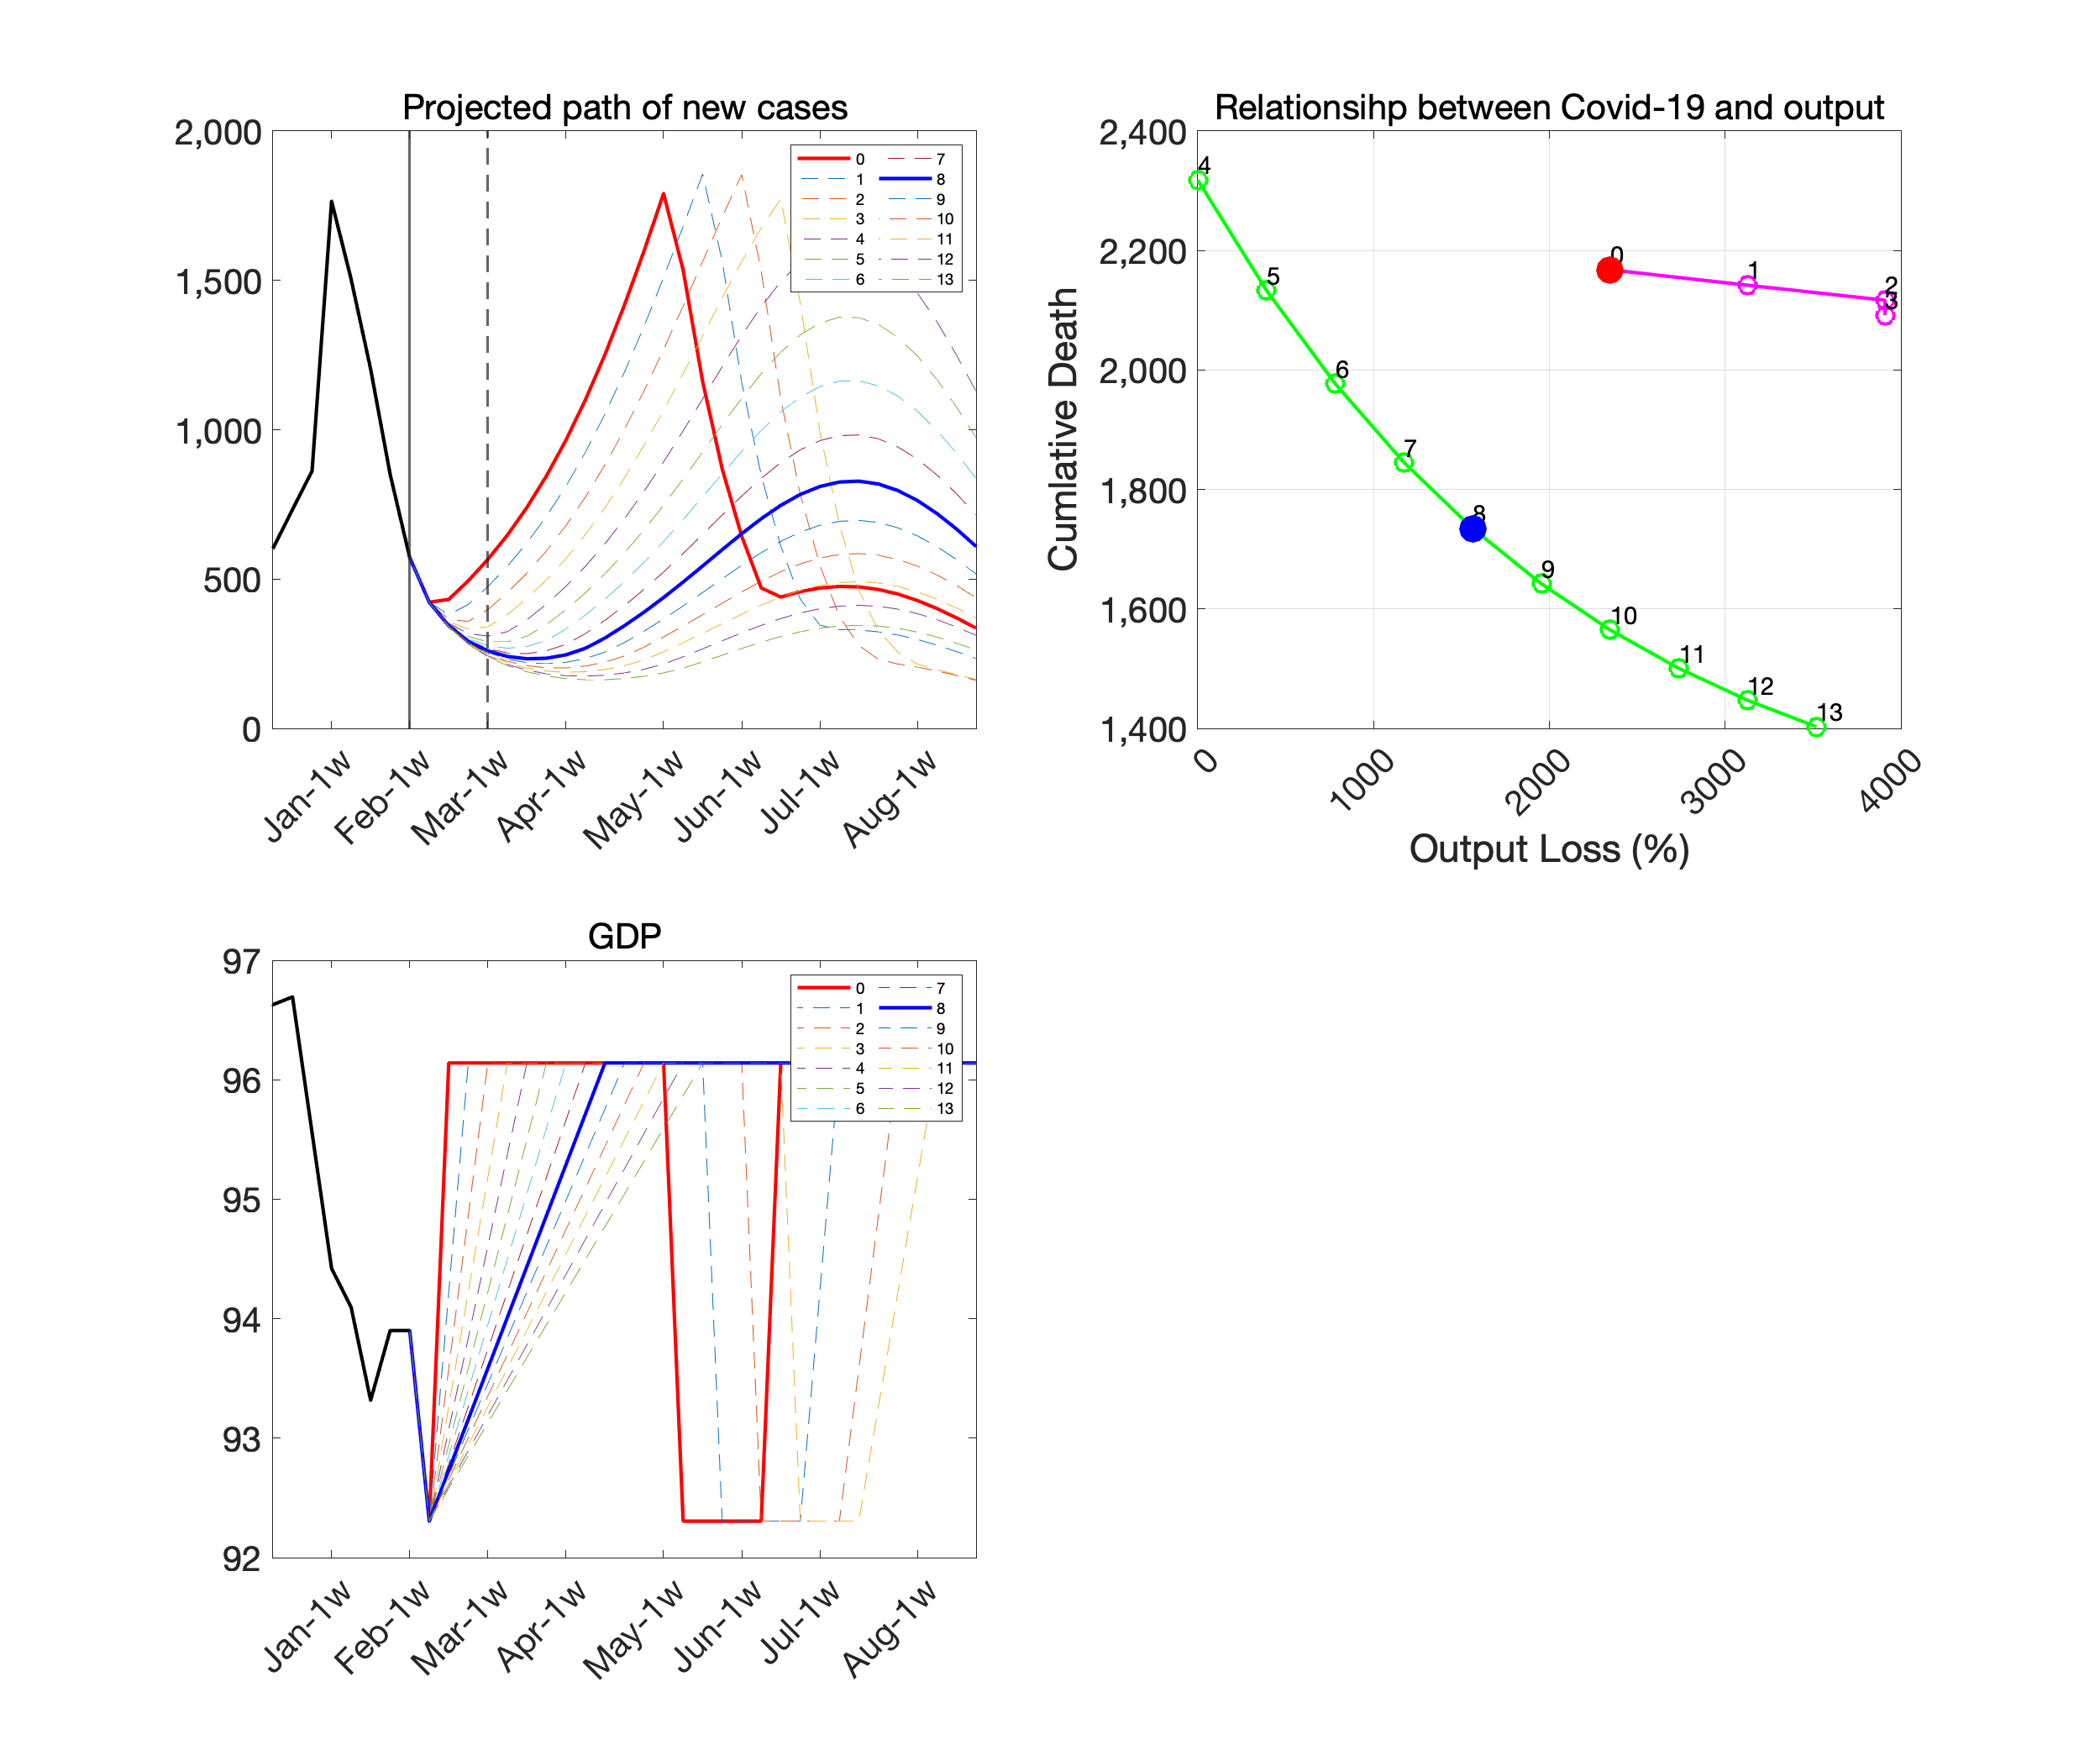 |
Source: Authors’ calculation.
2. Scenarios with immediate recovery of economic activity
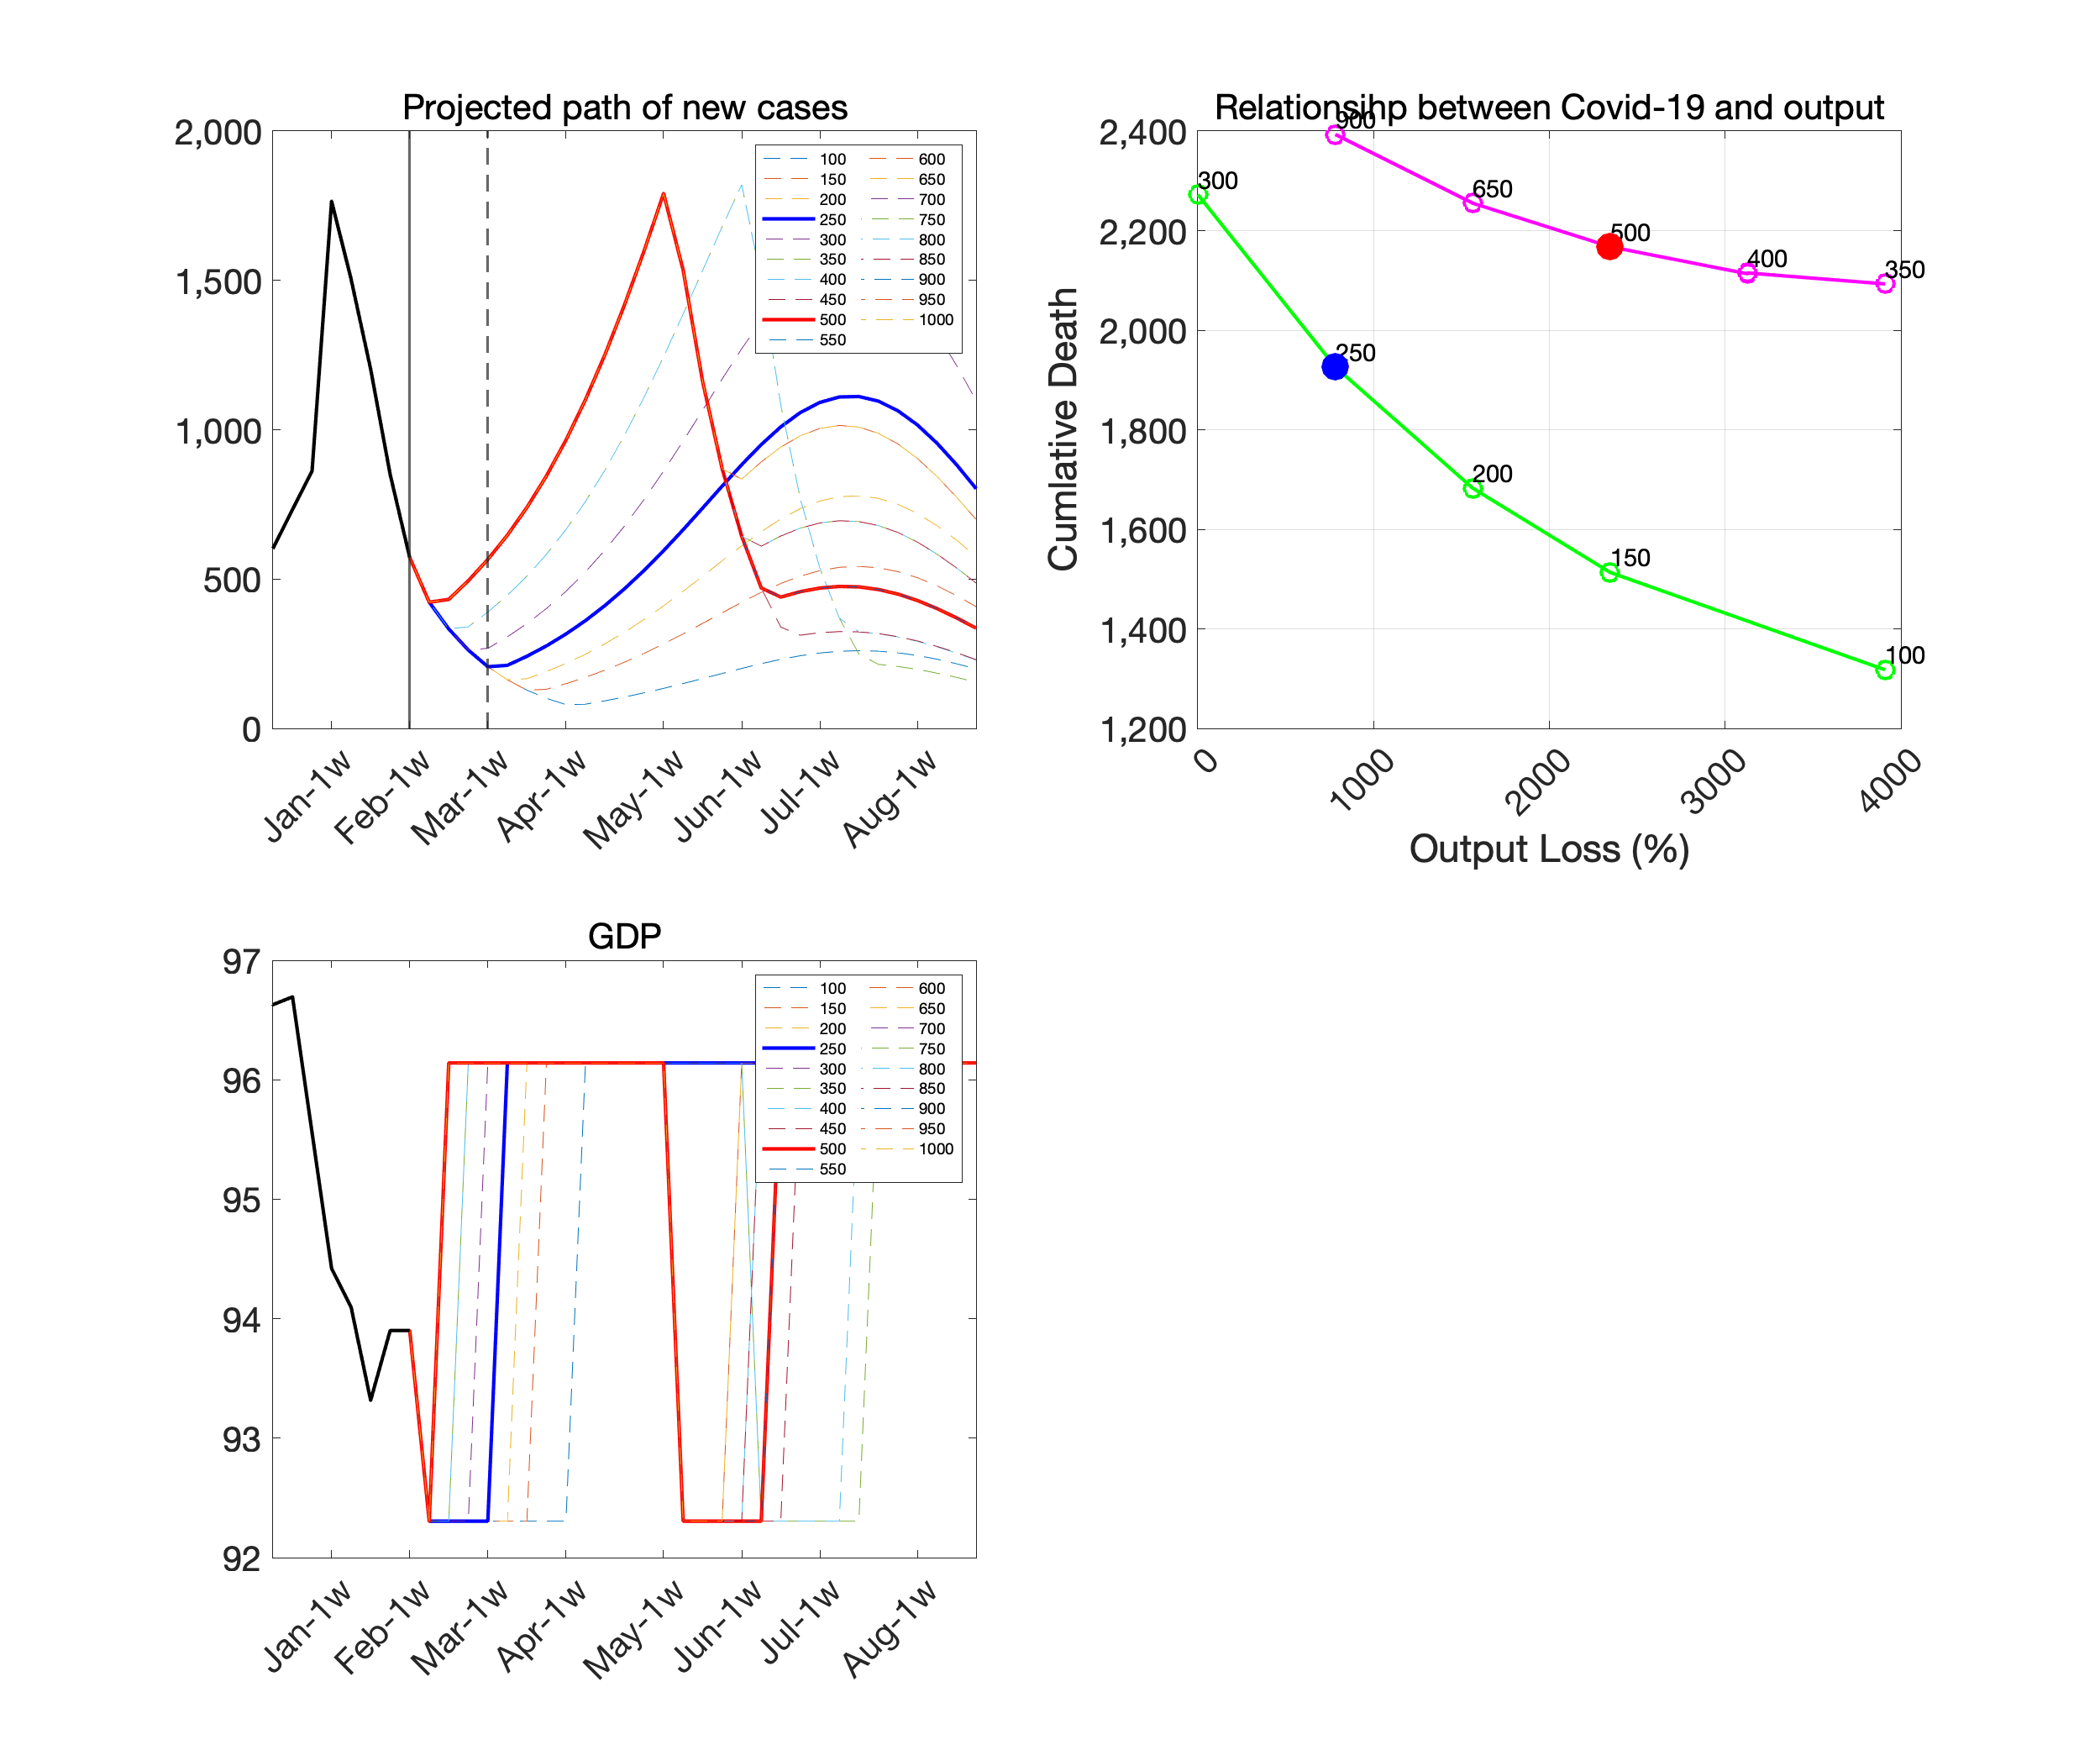 |
Source: Authors’ calculation.
Note: See Fujii and Nakata (2021) for a detailed discussion of the scenario.