Last update on February 25, 2021
** Based on the data available as of February 21, 2021. Click to enlarge each image.
Replications files are available here.
Note: We have corrected errors in the update on February 23.
For figures before the correction, [click here]
Link to other Osaka pages:
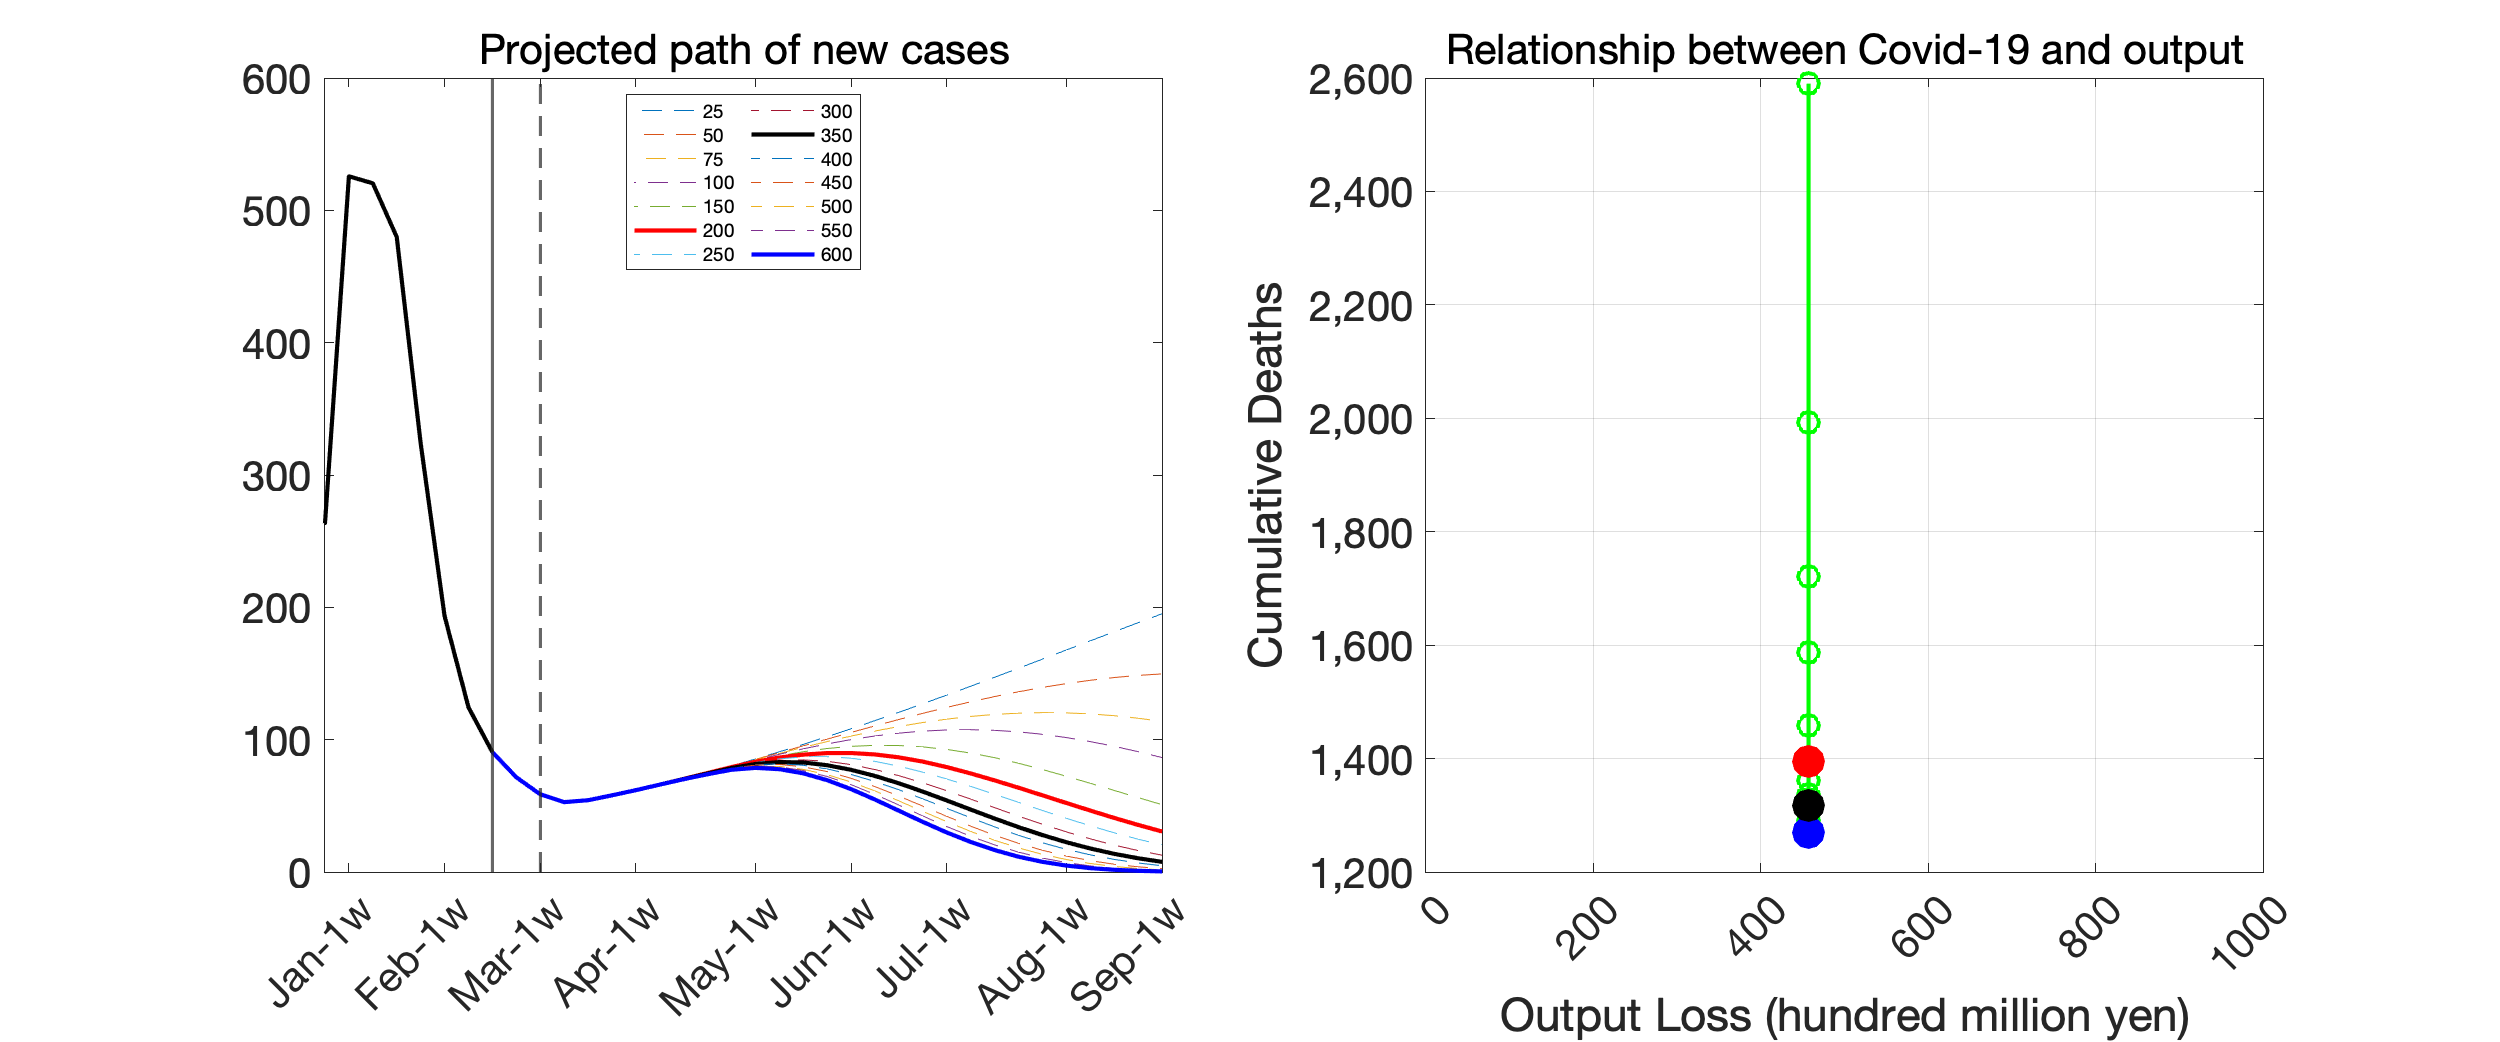
1. Scenarios with immediate recovery of economic activity
(A) Baseline scenario
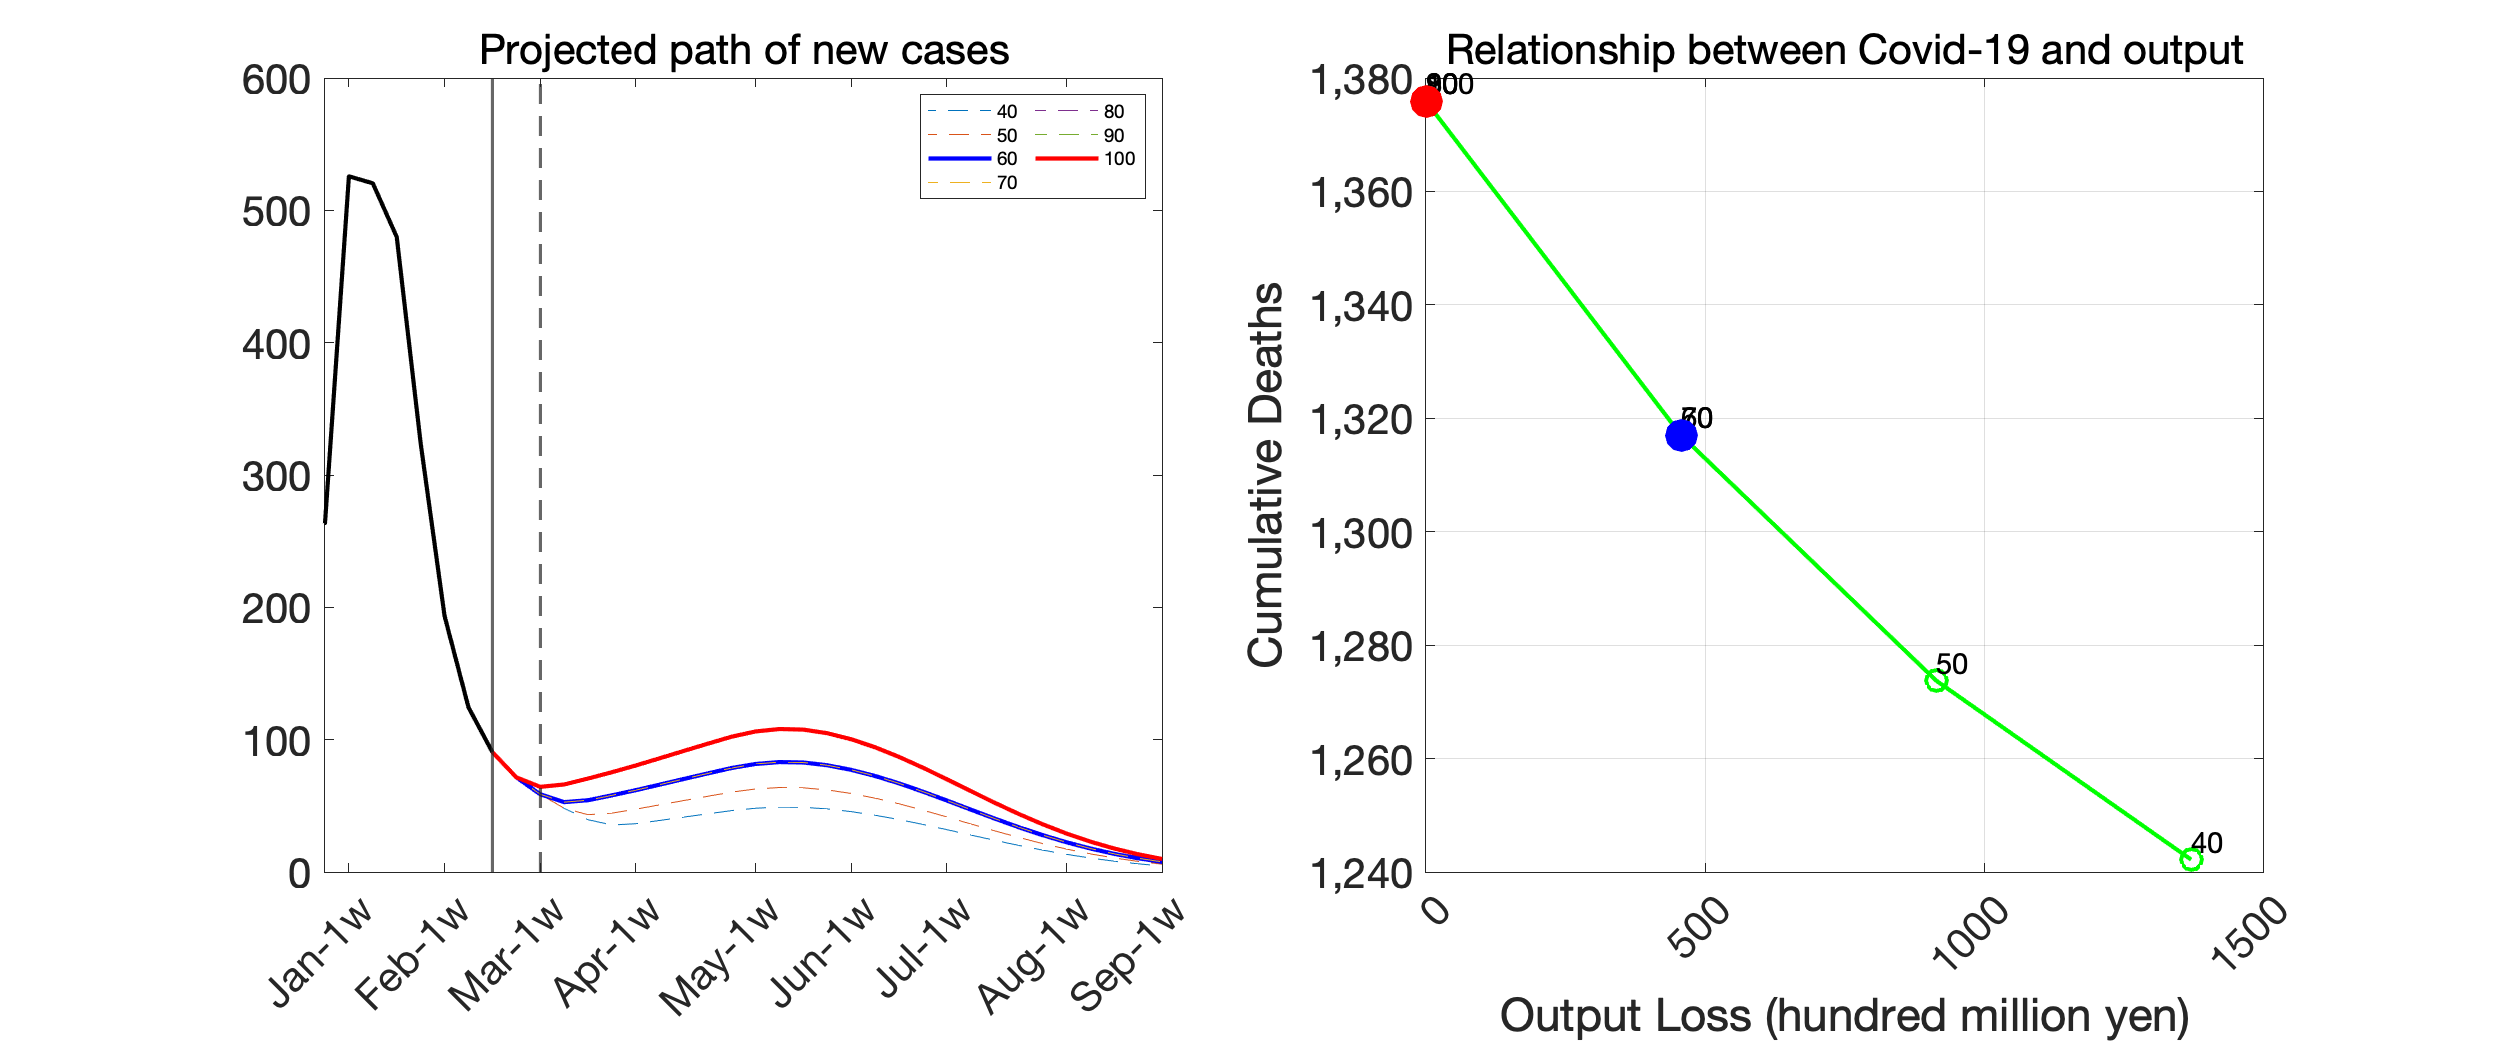 |
Source: Authors’ calculation.
Note: See Fujii and Nakata (2021) for a detailed discussion of the scenario.
(B) Alternative scenario
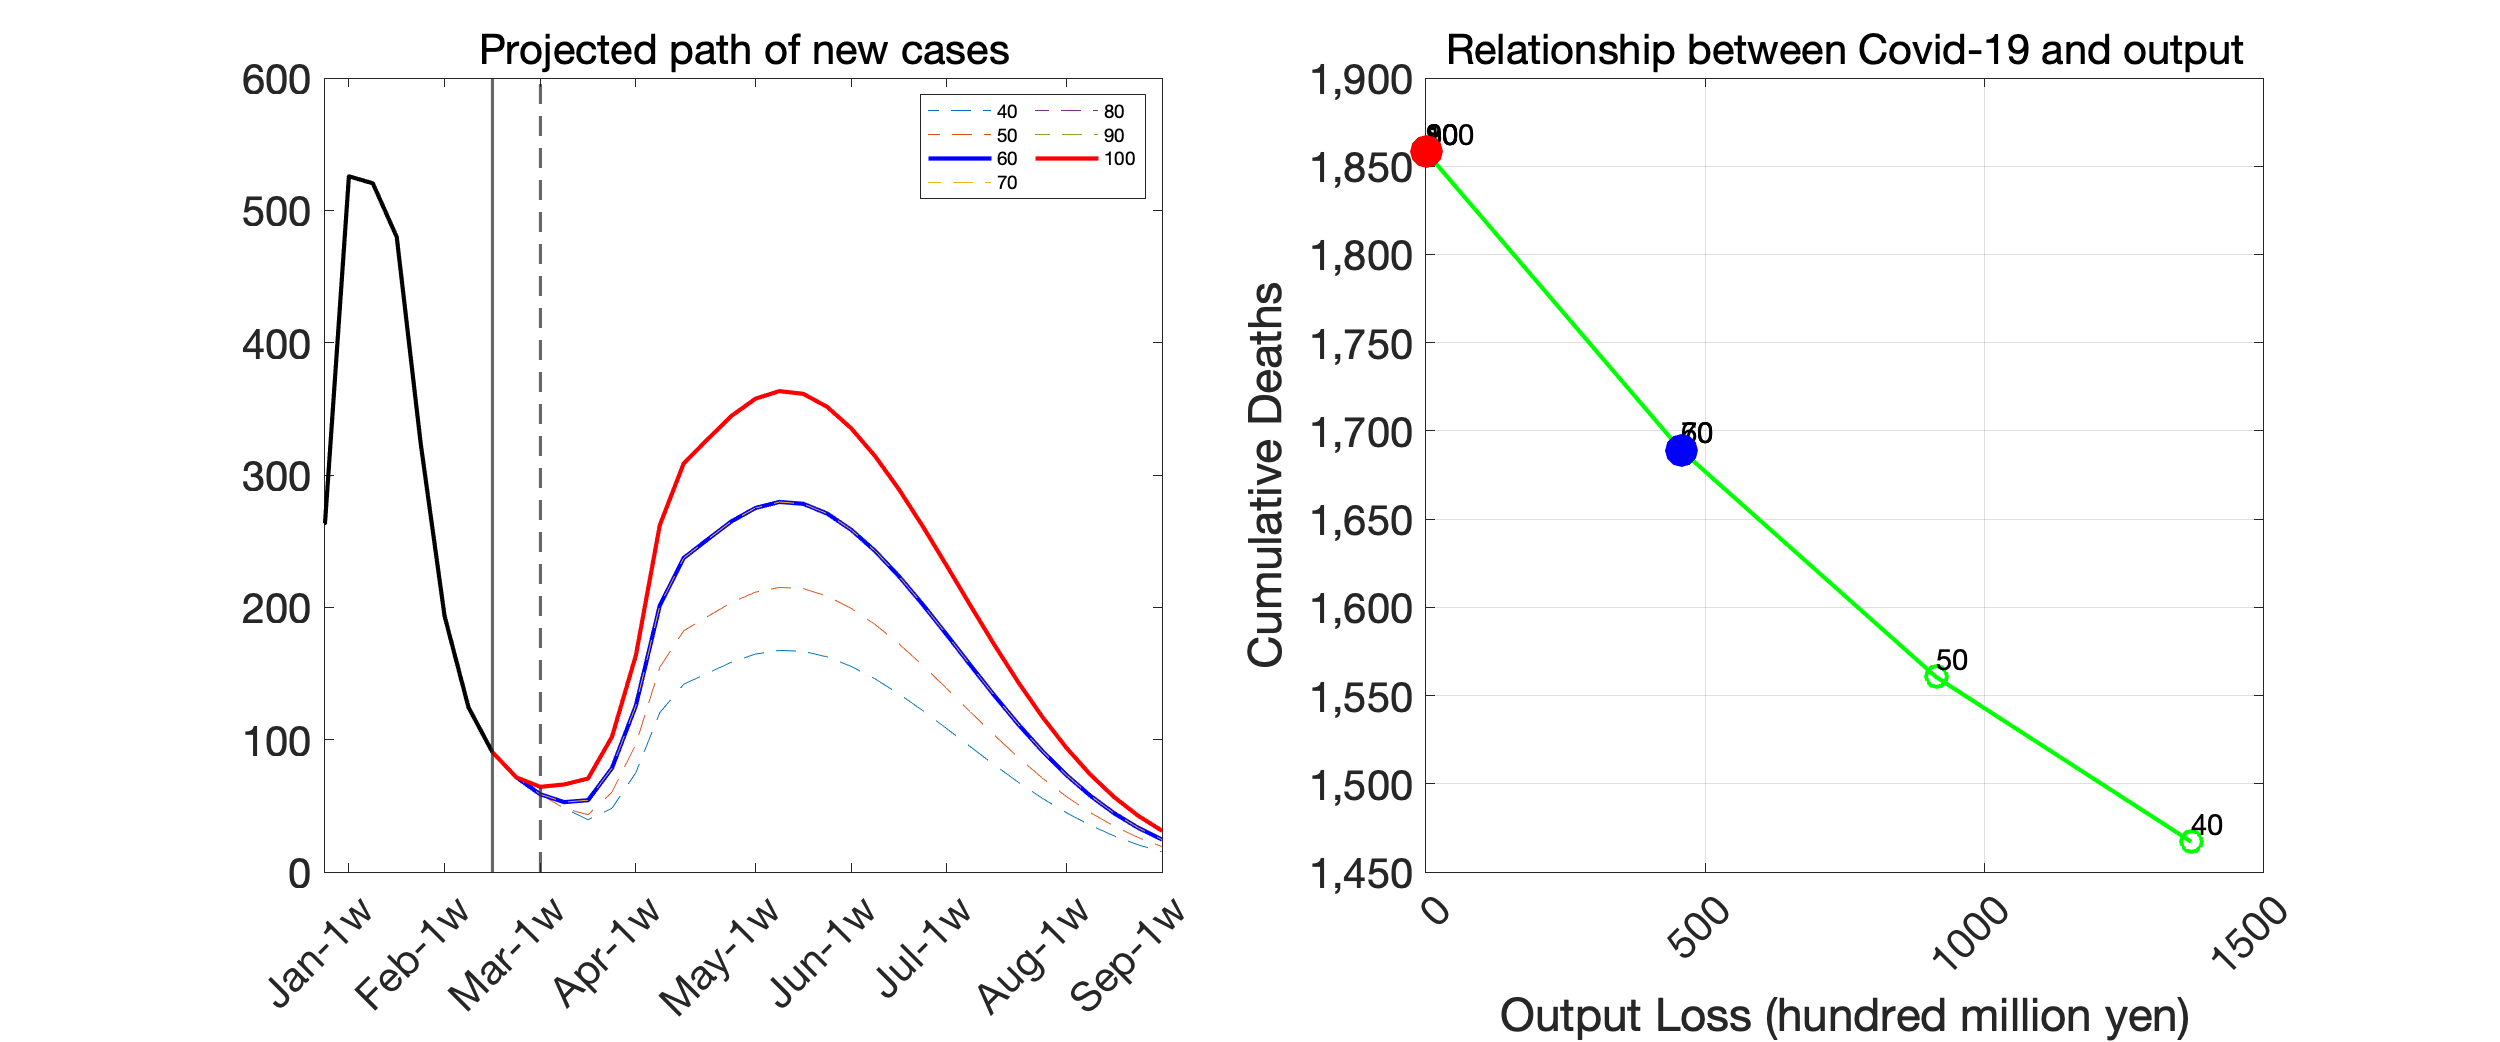 |
Source: Authors’ calculation.
Note: In this scenario, the effective reproduction number is assumed to be 1.3 times higher than the baseline scenario from March 22 to April 11.
2. Scenarios with gradual recovery of economic activity
(A) Baseline scenario
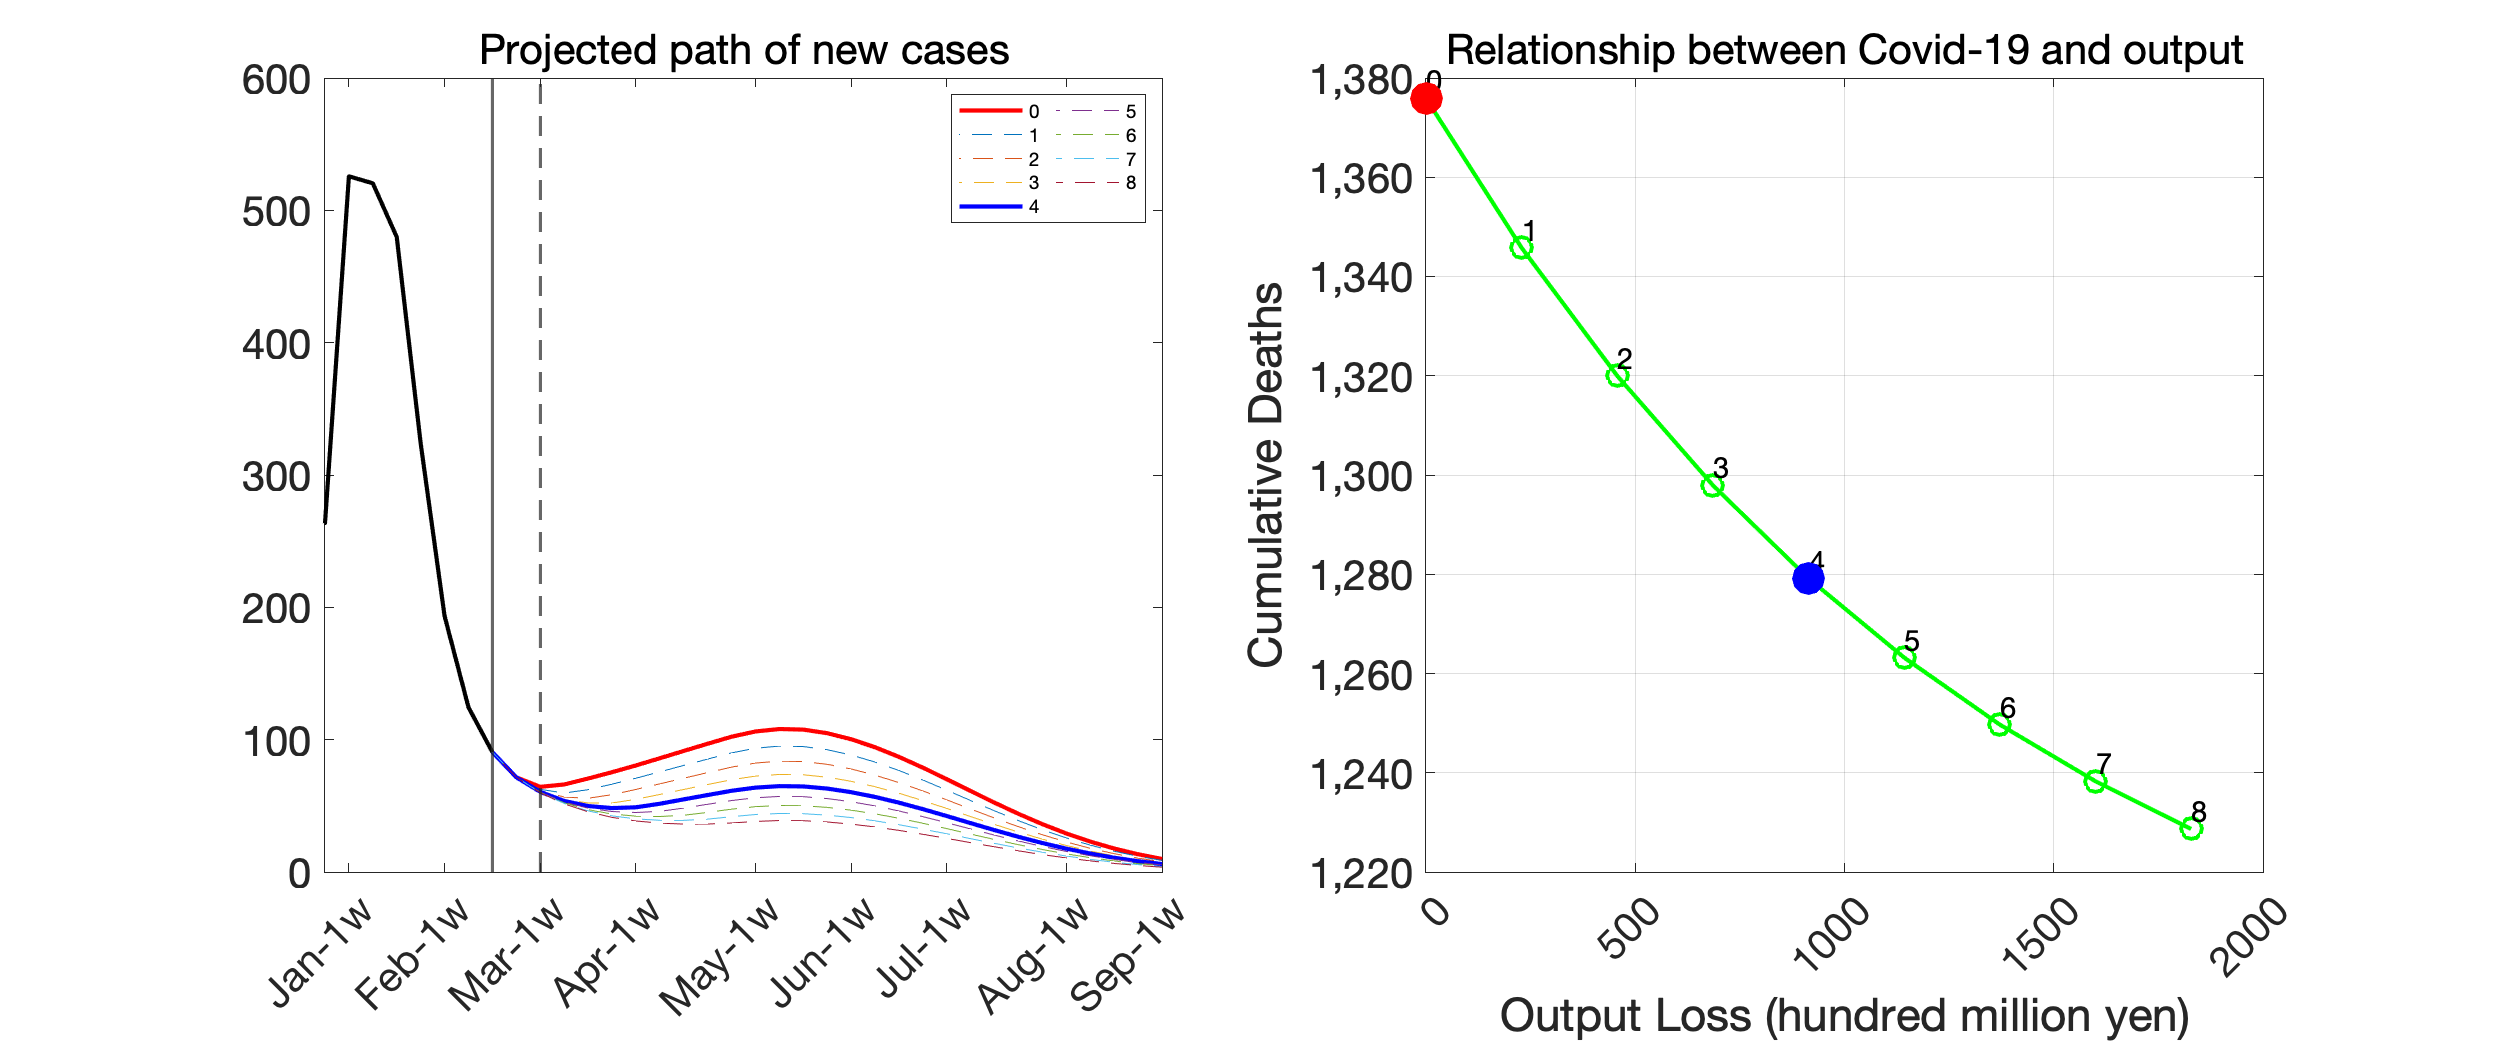 |
Source: Authors’ calculation.
(B) Alternative scenario
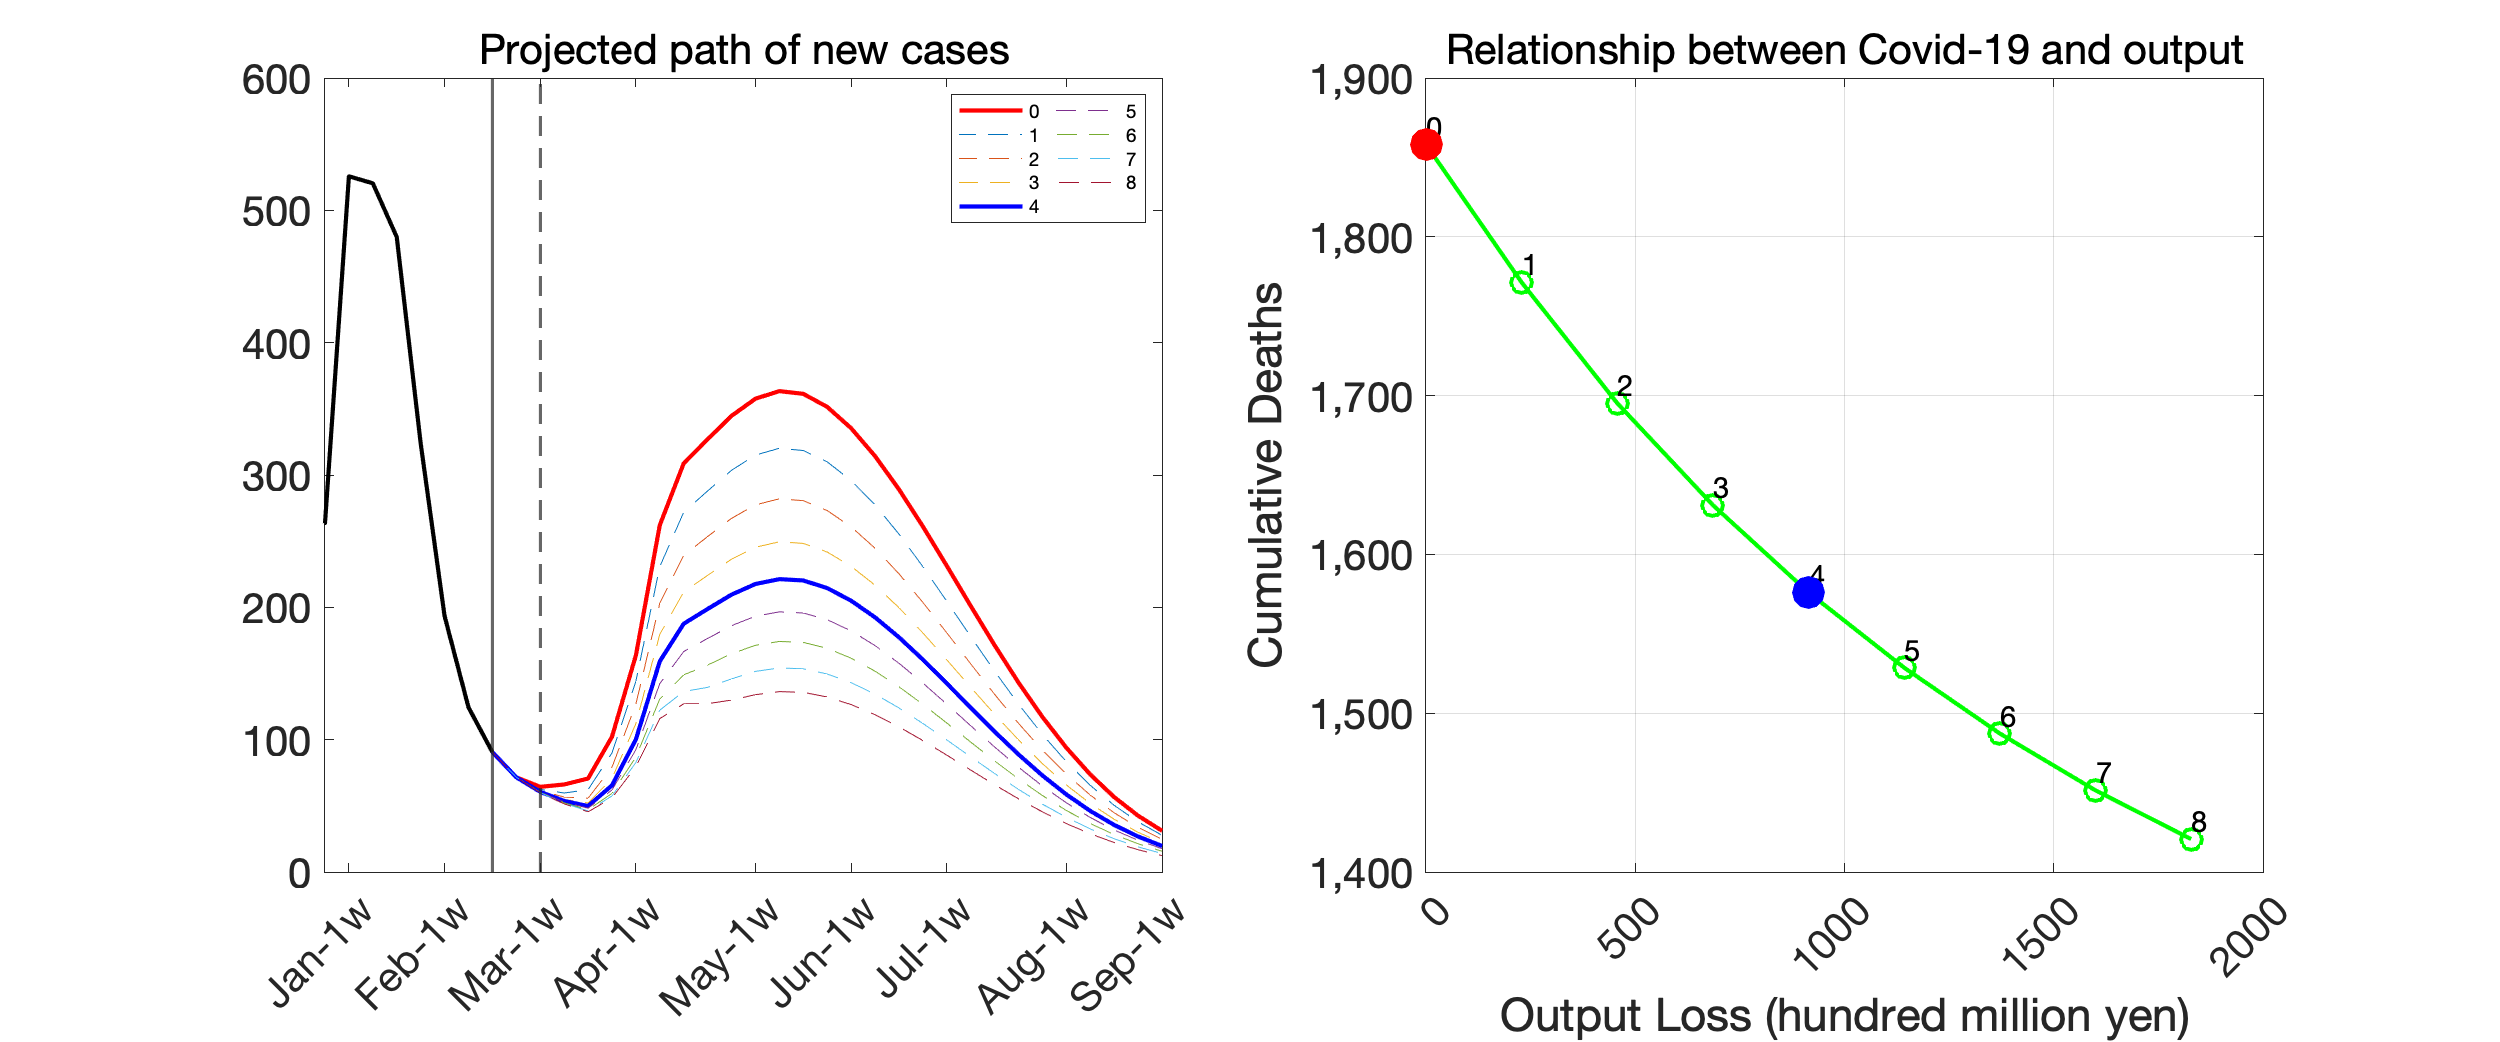 |
Source: Authors’ calculation.
3. Scenarios under various assumptions for the pace of vaccination
 |
Source: Authors’ calculation.